Monday, 30 September 2024

The Quest for the Perfect Spectrum – A Benchmark in Consensus Generati

 The Quest for the Perfect Spectrum – A Benchmark in Consensus Generation

In proteomics, where mass spectrometry generates oceans of data, efficient processing is critical for extracting meaningful insights. As with any large dataset, some information is redundant, and mass spectra are no exception. The task of grouping similar spectra into clusters and generating a consensus spectrum—a representative spectrum for each group—has emerged as a key step in modern proteomics workflows. While several methods exist for this, we explored in 2022 multiple ones in the manuscript titled “A Comprehensive Evaluation of Consensus Spectrum Generation Methods in Proteomics”, systematically for consensus spectrum generation, making a significant contribution to the field.


Monday, 24 February 2020

The need for a Sample to Data standard

The experimental design is a cornerstone of modern science, especially for data scientists.  But, How experimental design can be captured for better reuse, reproducibility, and understanding of the original results? How we can write in a file the complexity of our experimental design? 

This post is about that


ThermoRAWFileParser: A small step towards cloud proteomics solutions

Proteomics data analysis is in the middle of a big transition. We are moving from small experiments (e.g. a couple of RAW files, samples) to big large scale experiments. While the average number of RAW files per datasets in PRIDE hasn't grown in the last 6 years (Figure 1), we can see multiple experiments with more than 1000 RAW files (Figure 1 - right).

Figure 1: The boxplot of the number of files per dataset in PRIDE (left - outliers removed; right - outliers included) 

On the other side, File size shows a trend towards large RAW files (Figure 2).

Figure 2: Box plot of file size by datasets in PRIDE (outliers removed)

Then, how proteomics data analysis can be moved towards large scale and elastic compute architectures such as Cloud infrastructures or High-performance computing (HPC) clusters?

Friday, 15 November 2019

Chan Zuckerberg Initiative hit a home run

Maintaining bioinformatics infrastructures is really challenging with the current Grant schemes. Most of the time what you have ahead for your software are the following plans: bug fixing, documentation, user support, refactoring to make the software faster or compatible with different platforms or architectures... This is almost impossible to be sold by itself in a grant proposal. It needs to be blur or hidden in the proposal with new improvements, data support or data analysis.. probably with new ideas that the developer and the PI don't even try before. But still, you need to get the grant. 


Resultado de imagen de software developer cartoon"
In summary, the bioinformatics community is struggling to get money to maintain and support bioinformatics software and databases. Different initiatives and grant calls have been created in recent years to support and sustain the bioinformatics open-source community. But, they have encouraged the creation of "new/novel" things rather than support the development of well-established tools. And here, is when Mark and the Chan Zuckerberg Initiative succeed today.

The Chan Zuckerberg Initiative (CZI) announced the final list of bioinformatics open-source projects awarded with the CZI’s Grant. After reading the final list, it was clear to me that this group of reviewers really knows what they are doing and the CZI is really pushing forward to maintain bioinformatics infrastructures and software.


ELIXIR support the development of BioContainers


Originally posted in ELIXIR 
Building on the success of the 2018 ELIXIR Implementation Study on BioContainers, an open-source registry for over 81,000 life science research related containerised tools, ELIXIR has launched three follow-up projects to progress and maintain the work in this valuable area. ❡

What are containers and why are they important?

Data produced by life science research is always on the increase. Likewise there has been a huge increase in the number of tools and platforms required to support data intensive analysis. These tools, code, back-end software and compute environments come in many flavours meaning it can be challenging to select the appropriate tools and run them smoothly in a local setting.
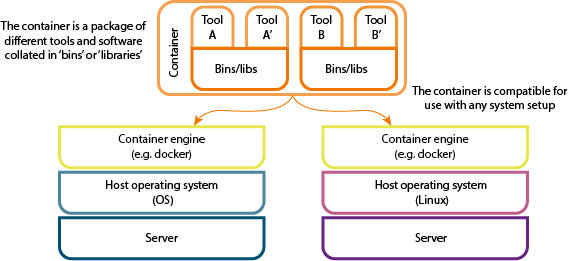
Software containers package up code and related dependencies so that software applications can run quickly and reliably from one computing environment to another. As an analogy, it’s like buying flat-pack furniture from IKEA: you have the instructions, components and tools all provided in a single package - enabling you to carry out the task (build the furniture) without having to source the required tools (screws, allen keys, instructions etc.).
This is an incredibly useful method of sharing analysis pipelines, software tools and documentation with collaborators and the wider scientific community thereby enabling reproducibility. Researchers can run the analysis without having to install dependencies and worry about the specific version of software that the person who originally created the pipeline used.
Diagram showing what a container is made of (tools and bins/libraries) and how it is compatible with different operating systems (e.g. Mac OS or Linux)

The BioContainers Registry

In 2018 ELIXIR launched a six month Implementation Study that aimed to build an infrastructure to help scientists within ELIXIR publish their software containers in a standardised manner. The result was the development of an open-source registry for life science research related to containers called BioContainers, which provided over 8,100 containerised tools. BioContainers is a community-driven project that provides the infrastructure and basic guidelines to create, manage and distribute bioinformatics packages (e.g. conda) and containers (e.g docker, singularity). 

Tuesday, 12 November 2019

If you haven't submit to bioRxiv, well, you should

We all know that the traditional publication process delays the dissemination of new research, often by months, sometimes by years.

Resultado de imagen de preprints"

Preprint servers decouple dissemination of research papers from their evaluation and certification by journals, allowing researchers to share work immediately, receive feedback from a much larger audience, and provide evidence of productivity long before formal publication. The arXiv preprint server, launched in 1991 and currently hosted by Cornell University, has demonstrated the effectiveness of this approach.

Monday, 11 November 2019

Proteomic identification through database Search by David L. Tabb

Best presentation to understand Peptide/Protein identification algorithms in Proteomics. 


Sunday, 10 November 2019

10 minutes guide to Bioconda

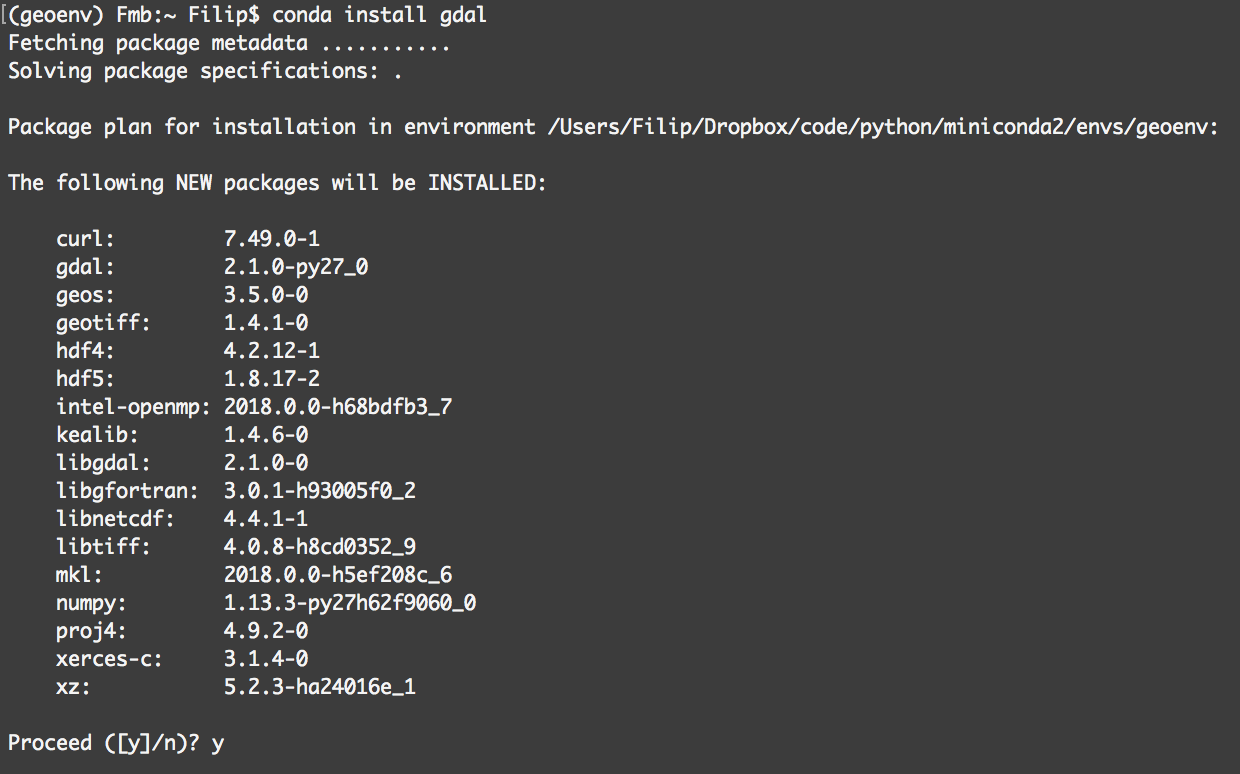
Bioinformatics is complicated, what with its arcane command-line interface, complex workflows, and massive datasets. For new bioinformaticians, installing the software can present a problem.

Resultado de imagen de installing conda package
But the good news is that the Bioinformatics community has already a solution to this problem: BioConda + BioContainers.

Saturday, 9 November 2019

Where to deposit my proteomics data: ProteomeXchange

The ProteomeXchange (PX) (http://www.proteomexchange.org) consortium aggregates the major proteomics resources and has standardized data submission and dissemination of mass spectrometry proteomics data worldwide since 2012. Since its inception, the ProteomeXchange (PX) has aimed to standardize data submission and dissemination of public MS proteomics data worldwide.


Some Stats are always welcome: In terms of distribution of datasets across individual resources, 12 335 datasets (87.1%), had been submitted to PRIDE, followed by MassIVE  (1 126 datasets, 7.9%), jPOST (352 datasets, 2.5%), iProX (174 datasets, 1.2%), PASSEL (139 datasets, 1.0%) and Panorama Public  (43 datasets, 0.3%).

Wednesday, 6 November 2019

List of major preprints servers - where to go

The most well-known preprint server is probably arXiv (pronounced like ‘archive’). It started as a server for preprints in physics and has since expanded out to various subjects, including mathematics, computer science, and economics. The arXiv server is now run by the Cornell University Library and contains 1.37 million preprints so far.

Resultado de imagen de preprints"

The Open Science Framework provides an open-source framework to help researchers and institutions set up their own preprint servers. One such example is SocArXiv for the Social Sciences. On their website, you can browse more than 2 million preprints, including preprints on arXiv, and many of them have their own preprint digital object identifier (DOI). In cases where the preprint has now been published it also links to the publication’s DOI.

Cold Spring Harbor Laboratory set up bioaRxiv, a preprint server for Biology in 2013 to complement arXiv. The bioaRxiv server has a direct transfer service to several journals such as Science and PNAS and a bit over 60% of papers in bioaRxiv end up published in peer-reviewed journals.

In more recent years a lot of new servers have popped up covering almost every field including the social sciences, arts, and humanities fields. Here’s a quick overview of some of the rest:

arXiv -> Mathematics, Computer science, and economics, Physics
EngrXiv - Engineering
ChemRxiv - Chemical sciences
PsyArXiv - Psychological sciences
SportaRxiv - Sport and exercise science
PaleoarXiv - Paleontology
LawArXiv - Law
AgriXiv - Agricultural sciences
NutriXiv - Nutritional sciences
MarXiv - Ocean and marine-climate sciences
EarthArXiv - Earth sciences
Preprints.org - Arts & Humanities, Behavioral Sciences, Biology, Chemistry, Earth Sciences, Engineering, Life Sciences, Materials Science, Mathematics & Computer Science, Medicine &, Pharmacology, Physical Sciences, Social Sciences

Saturday, 17 March 2018

Big Data: Is not only a fancy/catchy name

The field of biomedical research has a new trend to use fancy terms in the title of papers/grants in order to attract the attention of reviewers, journals and grant agencies. Amount others are: large-scale, complete map, draft, landscape, deep, full, and Big Data. Figure 1 shows the exponential use of these words in pubmed articles.


Figure 1: Number of mentions of specific terms in pubmed by years.

I will stop here to discuss the term Big data.

Sunday, 11 March 2018

Data Visualization: Plots You Should be Using More

Inspired by this blog post

1- Parallel Coordinates — A parallel coordinates graph arrays multiple variables alongside one another with each scaled from highest to the lowest value (highest at the top, lowest at the bottom) and with lines connecting each entity’s position for each variable, horizontally across the graph. Due to a large number of cases represented, it is often presented using an interactive view where individual lines can be selected and highlighted.

Wednesday, 24 January 2018

Monit: Monitoring your Services

Bioinformatics Applications are moving more in the direction of "Microservices" Architectures where services should be fine-grained and the protocols should be lightweight. Microservices Architectures decomposed the application into different smaller services improving the modularity; making the application easier to develop, deploy and maintain. It also parallelizes development by enabling small autonomous teams to develop, deploy and scale their respective services independently.


With more services (Databases, APIs, Web Applications, Pipelines) more components should be trace, monitor, to know the health of your application. There might be different roles that are played by different services (in different physical/logical machines) that can be even geographically isolated from each other. As a whole, these services/servers might be providing a combined service to the end application. A particular issue or problem on any of the server should not affect the final application behavior and must be found and fixed before the outage happens.

Multiple applications allow developers/devops and sysadmins to monitor all the services in a microservices application, but the most popular ones are Nagios and Monit.

Thursday, 9 June 2016

How to estimate and compute the isoelectric point of peptides and proteins?

By +Yasset Perez-Riverol and +Enrique Audain :

Isoelectric point (pI) can be defined as the point of singularity in a titration curve, corresponding to the solution pH value at which the net overall surface charge is equal to zero. Currently, there are available different modern analytical biochemistry and proteomics methods depend on the isoelectric point as a principal feature for protein and peptide characterization. Peptide/Protein fractionation according to their pI is widely used in current proteomics sample preparation procedures previous to the LC-MS/MS analysis. The experimental pI records generated by pI-based fractionation procedures are a valuable information to validate the confidence of the identifications, to remove false positive and and could be used to re-compute peptide/protein posterior error probabilities in MS-based proteomics experiments. 

Theses approaches require an accurate  theoretical prediction of pI. Even thought there are several tools/methods to predict the isoelectric point, it remains hard to define beforehand what methods perform well on a specific dataset.  

We believe that the best way to compute the isoelectric point (pI) is to have a complete package with most of the algorithms and methods in the state of the art that can do the job for you [2]. We recently developed an R package (pIR) to compute isoelectric point using long-standing and novels pI methods that can be grouped in three main categories : a) iterative, b) Bjellvist-based methods and c) machine learning methods. In addition, pIR also offers a statistical and graphical framework to evaluate the performance of each method and its capability to “detect” outliers (those peptides/protein with theoretical pI biased from experimental value) in a high-throughput environment.

First lets install the package:

First, we need to install devtools:
install.packages("devtools")
library(devtools)
Then we just call:
install_github("ypriverol/pIR")
library(pIR)

Saturday, 14 May 2016

Useful Links to prepare your presentation or talk

Creating effective slides: Design, Construction, and Use in Science:


Sunday, 13 March 2016

Genome Mapping and SNP Calling with BioDocker

#http://www.htslib.org/workflow/#mapping_to_variant
set -xeu

FQ1=y1.fastq
FQ2=y2.fastq
REF=yeast.fasta
BNM=yeastD

RUNINDOCKER=1

SAMTOOLS=samtools
BWA=bwa
TABIX=tabix
BCFTOOLS=bcftools
PLOTVCFSTATS=plot-vcfstats

if [[ "$RUNINDOCKER" -eq "1" ]]; then
echo "RUNNING IN DOCKER"
DRUN="docker run --rm -v $PWD:/data --workdir /data -i"
#--user=biodocker

SAMTOOLS_IMAGE=biodckr/samtools
BWA_IMAGE=biodckr/bwa
TABIX_IMAGE=biodckrdev/htslib:1.2.1
BCFTOOLS_IMAGE=biodckr/bcftools


docker pull $SAMTOOLS_IMAGE
docker pull $BWA_IMAGE
docker pull $TABIX_IMAGE
docker pull $BCFTOOLS_IMAGE

SAMTOOLS="$DRUN $SAMTOOLS_IMAGE $SAMTOOLS"
BWA="$DRUN $BWA_IMAGE $BWA"
TABIX="$DRUN $TABIX_IMAGE $TABIX"
BCFTOOLS="$DRUN $BCFTOOLS_IMAGE $BCFTOOLS"
PLOTVCFSTATS="$DRUN $BCFTOOLS_IMAGE $PLOTVCFSTATS"
else
echo "RUNNING LOCAL"
fi

HEADLEN=100000

if [[ ! -f "$FQ1" ]]; then
curl ftp://ftp.sra.ebi.ac.uk/vol1/fastq/SRR507/SRR507778/SRR507778_1.fastq.gz| gzip -d | head -$HEADLEN > $FQ1.tmp && mv $FQ1.tmp $FQ1
fi

if [[ ! -f "$FQ2" ]]; then
curl ftp://ftp.sra.ebi.ac.uk/vol1/fastq/SRR507/SRR507778/SRR507778_2.fastq.gz| gzip -d | head -$HEADLEN > $FQ2.tmp && mv $FQ2.tmp $FQ2
fi

if [[ ! -f "$REF" ]]; then
curl ftp://ftp.ensembl.org/pub/current_fasta/saccharomyces_cerevisiae/dna/Saccharomyces_cerevisiae.R64-1-1.dna_sm.toplevel.fa.gz | gunzip -c > $REF.tmp && mv $REF.tmp $REF
fi

if [[ ! -f "$REF.fai" ]]; then
$SAMTOOLS faidx $REF
fi

if [[ ! -f "$REF.bwt" ]]; then
$BWA index $REF
fi

if [[ ! -f "$BNM.sam" ]]; then
$BWA mem -R '@RG\tID:foo\tSM:bar\tLB:library1' $REF $FQ1 $FQ2 > $BNM.sam.tmp && mv $BNM.sam.tmp $BNM.sam
fi

if [[ ! -f "$BNM.bam" ]]; then
#$SAMTOOLS sort -O bam -T /tmp -l 0 --input-fmt-option SAM -o $BNM.tmp.bam $BNM.sam && mv $BNM.tmp.bam $BNM.bam
$SAMTOOLS sort -O bam -T /tmp -l 0 -o $BNM.tmp.bam $BNM.sam && mv $BNM.tmp.bam $BNM.bam
fi

if [[ ! -f "$BNM.cram" ]]; then
$SAMTOOLS view -T $REF -C -o $BNM.tmp.cram $BNM.bam && mv $BNM.tmp.cram $BNM.cram
fi

if [[ ! -f "$BNM.P.cram" ]]; then
$BWA mem $REF $FQ1 $FQ2 | \
$SAMTOOLS sort -O bam -l 0 -T /tmp - | \
$SAMTOOLS view -T $REF -C -o $BNM.P.tmp.cram - && mv $BNM.P.tmp.cram $BNM.P.cram
fi

#if [[ ! -f "" ]]; then
#$SAMTOOLS view $BNM.cram
#fi

#if [[ ! -f "" ]]; then
#$SAMTOOLS mpileup -f $REF $BNM.cram
#fi

if [[ ! -f "$BNM.vcf.gz" ]]; then
$SAMTOOLS mpileup -ugf $REF $BNM.bam | $BCFTOOLS call -vmO z -o $BNM.vcf.gz.tmp && mv $BNM.vcf.gz.tmp $BNM.vcf.gz
fi

if [[ ! -f "$BNM.vcf.gz.tbi" ]]; then
$TABIX -p vcf $BNM.vcf.gz
fi

if [[ ! -f "$BNM.vcf.gz.stats" ]]; then
$BCFTOOLS stats -F $REF -s - $BNM.vcf.gz > $BNM.vcf.gz.stats.tmp && mv $BNM.vcf.gz.stats.tmp $BNM.vcf.gz.stats
fi

mkdir plots &>/dev/null || true

#if [[ ! -f "plots/tstv_by_sample.0.png" ]]; then
#$PLOTVCFSTATS -p plots/ $BNM.vcf.gz.stats
#fi

if [[ ! -f "$BNM.vcf.filtered.gz" ]]; then
$BCFTOOLS filter -O z -o $BNM.vcf.filtered.gz -s LOWQUAL -i'%QUAL>10' $BNM.vcf.gz
fi

Wednesday, 21 October 2015

Installing MESOS in your Mac

1- Homebrew is an open source package management system for the Mac that simplifies installation of packages from source.

ruby -e "$(curl -fsSL https://raw.github.com/Homebrew/homebrew/go/install)"

2- Once you have Homebrew installed, you can install Mesos on your laptop with these two commands:

brew update
brew install mesos

You will need to wait while the most current, stable version of Mesos is downloaded, compiled, and installed on your machine. Homebrew will let you know when it’s finished by displaying a beer emoji in your terminal and a message like the following:

/usr/local/Cellar/mesos/0.19.0: 83 files, 24M, built in 17.4 minutes
Start Your Mesos Cluster

3- Running Mesos in your machine: Now that you have Mesos installed on your laptop, it’s easy to start your Mesos cluster. To see Mesos in action, spin up an in-memory master with the following command:

/usr/local/sbin/mesos-master --registry=in_memory --ip=127.0.0.1

A Mesos cluster needs at least one Mesos Master to coordinate and dispatch tasks onto Mesos Slaves. When experimenting on your laptop, a single master is all you need. Once your Mesos Master has started, you can visit its management console: http://localhost:5050


Since a Mesos Master needs slaves onto which it will dispatch jobs, you might also want to run some of those. Mesos Slaves can be started by running the following command for each slave you wish to launch:

sudo /usr/local/sbin/mesos-slave --master=127.0.0.1:5050


Wednesday, 30 September 2015

First Scrum Board

Here, my first Scrum board to guide the release of OmicsDI project.

Team members update the task board continuously each sprint; if someone thinks of a new task (“test a new machine learning algorithm”), she writes a new card and puts it on the wall. Either during or before the daily scrum, estimates are changed (up or down), and cards are moved around the board.

Each row on the Scrum board is a user story, which is the unit of work we encourage teams to use for their product backlog.

During the sprint planning meeting, the team selects the product backlog items they can complete during the next Spring. Each product backlog item is turned into multiple sprint backlog items. Each of these is represented by one task card that is placed on the Scrumboard.

  • Story (User Story): The story description (“As a user we want to…”) shown on that row.
  • Ongoing:  Any card being worked on goes here. The programmer who chooses to work on it moves it over when she's ready to start the task. Often, this happens during the daily scrum when someone says, “I'm going to work on the boojum today.”
  • Testing: A lot of tasks have corresponding test task cards. So, if there's a “Code the boojum class” card, there is likely one or more task cards related to testing: “Test the boojum”, “Write FitNesse tests for the boojum,” “Write FitNesse fixture for the boojum,” 
  • Done: Cards pile up over here when they're done. They're removed at the end of the sprint. Sometimes we remove some or all during a sprint if there are a lot of cards.

Optionally, depending on the team, the culture, the project and other considerations:
  • Notes: Just a place to jot a note or two.
  • Tests Specified: We like to do “Story Test-Driven Development,” or “Acceptance Test-Driven Development,” which means the tests are written before the story is coded. Many teams find that it helps to have acceptance tests identified before coding begins on a particular story. This column just contains a checkmark to indicate the tests are specified.

Friday, 11 September 2015

An API for all MS-based File formats

We recently released and published our first Java API (Application Programming Interface) for the most common file formats in proteomics, not only ms files but also identification files such as mzIdentML and mztab. 

ms-data-core-api (https://github.com/PRIDE-Utilities/ms-data-core-api)

The library allow the end-users and the developers to use a common data structure for proteomics independently of the file types, and .. But first lets try to understand what is a API.

What is an API?

Imagine you are a builder or civil engineering and your are building your bridge, different components, blocks and different teams needs to be coordinated and plugged for the final results. Wrong communications between the members of the teams, different block sizes or building plans only produced strange results. 

In the simplest terms, APIs are sets of requirements, data structures, objects that govern how applications and software components can talk each other. An API, is a set of routines and protocols that provide building blocks for computer programmers and web developers to build software applications. In the past, APIs were largely associated with computer operating systems and desktop applications. In recent years though, we have seen the emergence of Web APIs (Web Services).


What is ms-data-core-api?

The ms-data-core-api is a free, open-source library for developing computational proteomics tools and pipelines. The Application Programming Interface, written in Java, enables rapid tool creation by providing a robust, pluggable programming interface and common data model. The data model is based on controlled vocabularies/ontologies and captures the whole range of data types included in common proteomics experimental workflows, going from spectra to peptide/protein identifications to quantitative results. 

The library contains readers for three of the most used Proteomics Standards Initiative standard file formats: mzML, mzIdentML, and mzTab. In addition to mzML, it also supports other common mass spectra data formats: dta, ms2, mgf, pkl, apl (text-based), mzXML and mzData (XML-based). Also, it can be used to read PRIDE XML, the original format used by the PRIDE database, one of the world-leading proteomics resources. Finally, we present a set of algorithms and tools whose implementation illustrates the simplicity of developing applications using the library.