Best presentation to understand Peptide/Protein identification algorithms in Proteomics.
Monday, 11 November 2019


Sunday, 10 November 2019
10 minutes guide to Bioconda
Bioinformatics is complicated, what with its arcane command-line interface, complex workflows, and massive datasets. For new bioinformaticians, installing the software can present a problem.
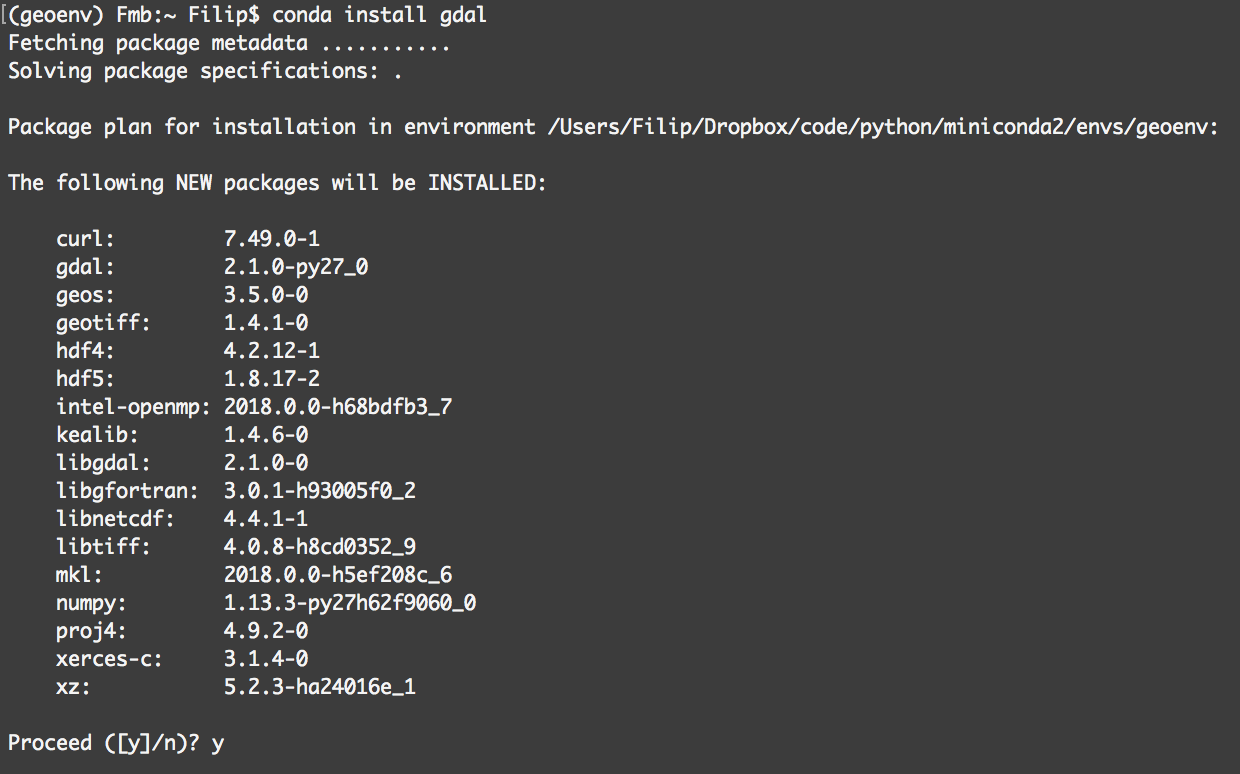 But the good news is that the Bioinformatics community has already a solution to this problem: BioConda + BioContainers.
Saturday, 9 November 2019
Where to deposit my proteomics data: ProteomeXchange
The ProteomeXchange (PX) (http://www.proteomexchange.org) consortium aggregates the major proteomics resources and has standardized data submission and dissemination of mass spectrometry proteomics data worldwide since 2012. Since its inception, the ProteomeXchange (PX) has aimed to standardize data submission and dissemination of public MS proteomics data worldwide.

Some Stats are always welcome: In terms of distribution of datasets across individual resources, 12 335 datasets (87.1%), had been submitted to PRIDE, followed by MassIVE (1 126 datasets, 7.9%), jPOST (352 datasets, 2.5%), iProX (174 datasets, 1.2%), PASSEL (139 datasets, 1.0%) and Panorama Public (43 datasets, 0.3%).
Wednesday, 6 November 2019
List of major preprints servers - where to go
The most well-known preprint server is probably arXiv (pronounced like ‘archive’). It started as a server for preprints in physics and has since expanded out to various subjects, including mathematics, computer science, and economics. The arXiv server is now run by the Cornell University Library and contains 1.37 million preprints so far.

The Open Science Framework provides an open-source framework to help researchers and institutions set up their own preprint servers. One such example is SocArXiv for the Social Sciences. On their website, you can browse more than 2 million preprints, including preprints on arXiv, and many of them have their own preprint digital object identifier (DOI). In cases where the preprint has now been published it also links to the publication’s DOI.
Cold Spring Harbor Laboratory set up bioaRxiv, a preprint server for Biology in 2013 to complement arXiv. The bioaRxiv server has a direct transfer service to several journals such as Science and PNAS and a bit over 60% of papers in bioaRxiv end up published in peer-reviewed journals.
In more recent years a lot of new servers have popped up covering almost every field including the social sciences, arts, and humanities fields. Here’s a quick overview of some of the rest:
arXiv -> Mathematics, Computer science, and economics, Physics
EngrXiv - Engineering
ChemRxiv - Chemical sciences
PsyArXiv - Psychological sciences
SportaRxiv - Sport and exercise science
PaleoarXiv - Paleontology
LawArXiv - Law
AgriXiv - Agricultural sciences
NutriXiv - Nutritional sciences
MarXiv - Ocean and marine-climate sciences
EarthArXiv - Earth sciences
Preprints.org - Arts & Humanities, Behavioral Sciences, Biology, Chemistry, Earth Sciences, Engineering, Life Sciences, Materials Science, Mathematics & Computer Science, Medicine &, Pharmacology, Physical Sciences, Social Sciences
Saturday, 17 March 2018
Big Data: Is not only a fancy/catchy name
The field of biomedical research has a new trend to use fancy terms in the title of papers/grants in order to attract the attention of reviewers, journals and grant agencies. Amount others are: large-scale, complete map, draft, landscape, deep, full, and Big Data. Figure 1 shows the exponential use of these words in pubmed articles.
I will stop here to discuss the term Big data.
 | |
|
I will stop here to discuss the term Big data.
Sunday, 11 March 2018
Data Visualization: Plots You Should be Using More
Inspired by this blog post
1- Parallel Coordinates — A parallel coordinates graph arrays multiple variables alongside one another with each scaled from highest to the lowest value (highest at the top, lowest at the bottom) and with lines connecting each entity’s position for each variable, horizontally across the graph. Due to a large number of cases represented, it is often presented using an interactive view where individual lines can be selected and highlighted.

1- Parallel Coordinates — A parallel coordinates graph arrays multiple variables alongside one another with each scaled from highest to the lowest value (highest at the top, lowest at the bottom) and with lines connecting each entity’s position for each variable, horizontally across the graph. Due to a large number of cases represented, it is often presented using an interactive view where individual lines can be selected and highlighted.

Subscribe to:
Posts (Atom)